Charitable Giving Statistics
Individual and Family Philanthropy
95.4% of households give to charity.1
The average annual household contribution is $2,9742.1
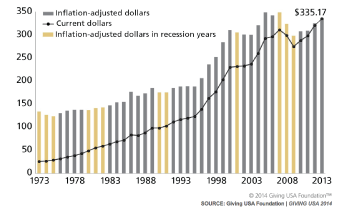
Americans gave $335.17 billion in 2013. This reflects a 4.4% increase from 2011.2
Corporate giving held steady in 2013 at $16.76 billion.2
Foundation giving increased in 2013 to $50.28 billion–a 5.7% increase from 2011.4
In 2013, the largest source of charitable giving came from individuals at $241.32 billion, or 72% of total giving; followed by foundations ($50.28 billion/15%), bequests ($26.81 billion/8%), and corporations ($16.76 billion/5%).2
In 2013, the majority of charitable dollars went to religion (31%), education (16%), human services (12%), and grantmaking foundations (11%).2
Education experienced the largest giving increase in 2013, receiving 8.9% more than the previous year.2
Charitable giving accounted for 2% of gross domestic product in 2013.2
Historically, charitable giving rises about one-third as fast as the stock market.3
It is estimated that between $6.6 trillion and $27.4 trillion in charitable bequests will be made between 1998-2052.5
It is estimated total charitable contributions will total between $21.2 to $55.4 trillion in between 1998-2052.5
By the year 2055, some $41 trillion will change hands as Americans pass on their accumulated assets to the next generation.5
95% of high net worth households give to charity.6
62% of high net worth donors cite “giving back to the community” as a chief motivation for giving.6
Last year, the greatest percentage of high net worth households gave to educational (80 percent) and basic needs (79 percent) organizations, followed by 69% to the arts, 65% to health related organizations, and 65% to religious organizations.6
In 2013, 100 of the largest charities reported receiving 13% more in online donations, and 25 of these charities collected more than $10 million each in 2013 from online gifts.7