
Why is this important?
Average annual wage by sector gives insight into the health of Spokane County’s economy. Wages and salaries form the largest component of personal income, one of the two fundamental measures of the size of a state economy. Economists typically tie private sector wage growth to labor productivity growth.
Wages vary by many factors, including the education or training required of the job, the supply of job-seekers, regional demand for certain skills, experience of the job seeker, as well as the pull of other nearby labor markets. Wage variation by sector may guide job-seekers or students in their choice of educational specialization. It may also inform providers of education and work-force training about their program design and offerings.
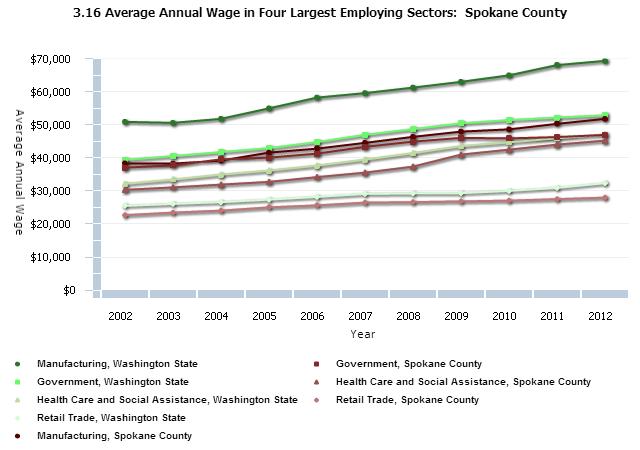
This indicator tracks the average wage paid by each of the top four sectors, as ranked by their number of employees for Spokane County as a whole (see indicator 3.9 for employment shares in these sectors). The graph shows only the top four sectors due to space limitations, but more are available in a downloadable spreadsheet via the “Download Data” link on the graph page for this indicator.
Data for this statistic come from the Labor Market and Economic Analysis (LMEA) branch of the Washington State Employment Security Department. These wage averages do not include the salaries claimed by the self-employed, the military, students living on campus or employed on campus, and Native Americans working on reservations.
Government includes employees of federal, state and municipal entities. Educators employed by public entities (K-12, higher education) are also a part of government.
In 2012, manufacturing in Spokane County, the smallest of the four sectors, paid the highest wages in the county, at $51,769. The Spokane sector employing the highest numbers, government (including education), yielded the next highest annual average wage, at $46,914. The second-largest sector, healthcare and social assistance, paid $45,184, while retail paid the least at $27,988. Wages trended upward for all four sectors over the period.
In all sectors, over all periods measured, Spokane annual wage earnings lagged those of the state. This was especially true of manufacturing. Annual average wages in 2012 for employees of Washington manufacturing companies were $69,304, which is $17,535 higher than the average manufacturing wage in the county. State annual average wages vary the least from Spokane County in the healthcare and social assistance and retail sectors.
Data Sources
Washington State Employment Security Department: Labor Market and Analysis Branch (LMEA)